Workflow Overview
The InSAR Norway Change Detection toolkit follows a streamlined three-step process designed for both technical and non-technical users.
Process Flow
flowchart TD
    A[Define Area of Interest] --> B[Query Data]
    B --> C[Download InSAR Data]
    C --> D[Choose Algorithm]
    D --> E[Process Data]
    E --> F[Generate Results]
    F --> G[Interactive Map View]
    F --> H[Time-Series Plots]

    subgraph S1 ["Step 1: Query Data"]
        A
        B
        C
    end

    subgraph S2 ["Step 2: Process Data"]
        D
        E
        F
    end

    subgraph S3 ["Step 3: Visualize Results"]
        G
        H
    end

    style A fill:#e1f5fe
    style B fill:#e1f5fe
    style C fill:#e1f5fe
    style D fill:#f3e5f5
    style E fill:#f3e5f5
    style F fill:#f3e5f5
    style G fill:#e8f5e8
    style H fill:#e8f5e8
    style S1 fill:#f8f9fa
    style S2 fill:#f8f9fa
    style S3 fill:#f8f9fa
Detailed Workflow
Step 1: Query Data
Script: insar-query.py
- Define your area: Specify coordinates using bounding box
- Choose time period: Select from available datasets (2018-2024)
- Download data: Automatically retrieve Sentinel-1 InSAR data
| Bash | |
|---|---|
Step 2: Process Data
Script: hybrid_detector-cpu.py
- Select algorithm: Choose detection sensitivity level
- Configure parameters: Set thresholds and processing options
- Run analysis: Process time-series data to detect changes
| Bash | |
|---|---|
Step 3: Visualize Results
Scripts: gis_map_viewer.py and insar-visualizer-cpu.py
- Interactive map: Web-based GIS viewer with point details
- Time-series plots: Detailed analysis of detected changes
- Export options: Save results and visualizations
| Bash | |
|---|---|
Algorithm Options
graph LR
    A[Choose Algorithm] --> B[Ultra-Selective]
    A --> C[Moderate]
    A --> D[Gradual]
    A --> E[Maximum Yield]

    B --> B1[Highest Confidence<br>Fewest Results]
    C --> C1[Balanced Approach<br>Recommended]
    D --> D1[Long-term Changes<br>Comprehensive]
    E --> E1[All Potential Changes<br>Most Results]

    style C fill:#e8f5e8
    style C1 fill:#e8f5e8
Data Flow
sequenceDiagram
    participant U as User
    participant Q as insar-query.py
    participant API as InSAR Norway API
    participant P as hybrid_detector-cpu.py
    participant V as Visualization Tools

    U->>Q: Define area & time period
    Q->>API: Request available datasets
    API-->>Q: Return dataset list
    Q->>API: Download InSAR data
    API-->>Q: Provide CSV files
    Q-->>U: Data ready for processing

    U->>P: Choose algorithm & run
    P->>P: Analyze time-series data
    P-->>U: Generate results CSV

    U->>V: Launch map viewer
    V-->>U: Interactive visualization
Key Benefits
| Step | Benefit | Output |
|---|---|---|
| Query | Automated data access | Raw InSAR measurements |
| Process | Intelligent change detection | Filtered significant changes |
| Visualize | Interactive exploration | Maps, plots, and insights |
Example Result
Here's what you can achieve with the InSAR Norway Change Detection toolkit:
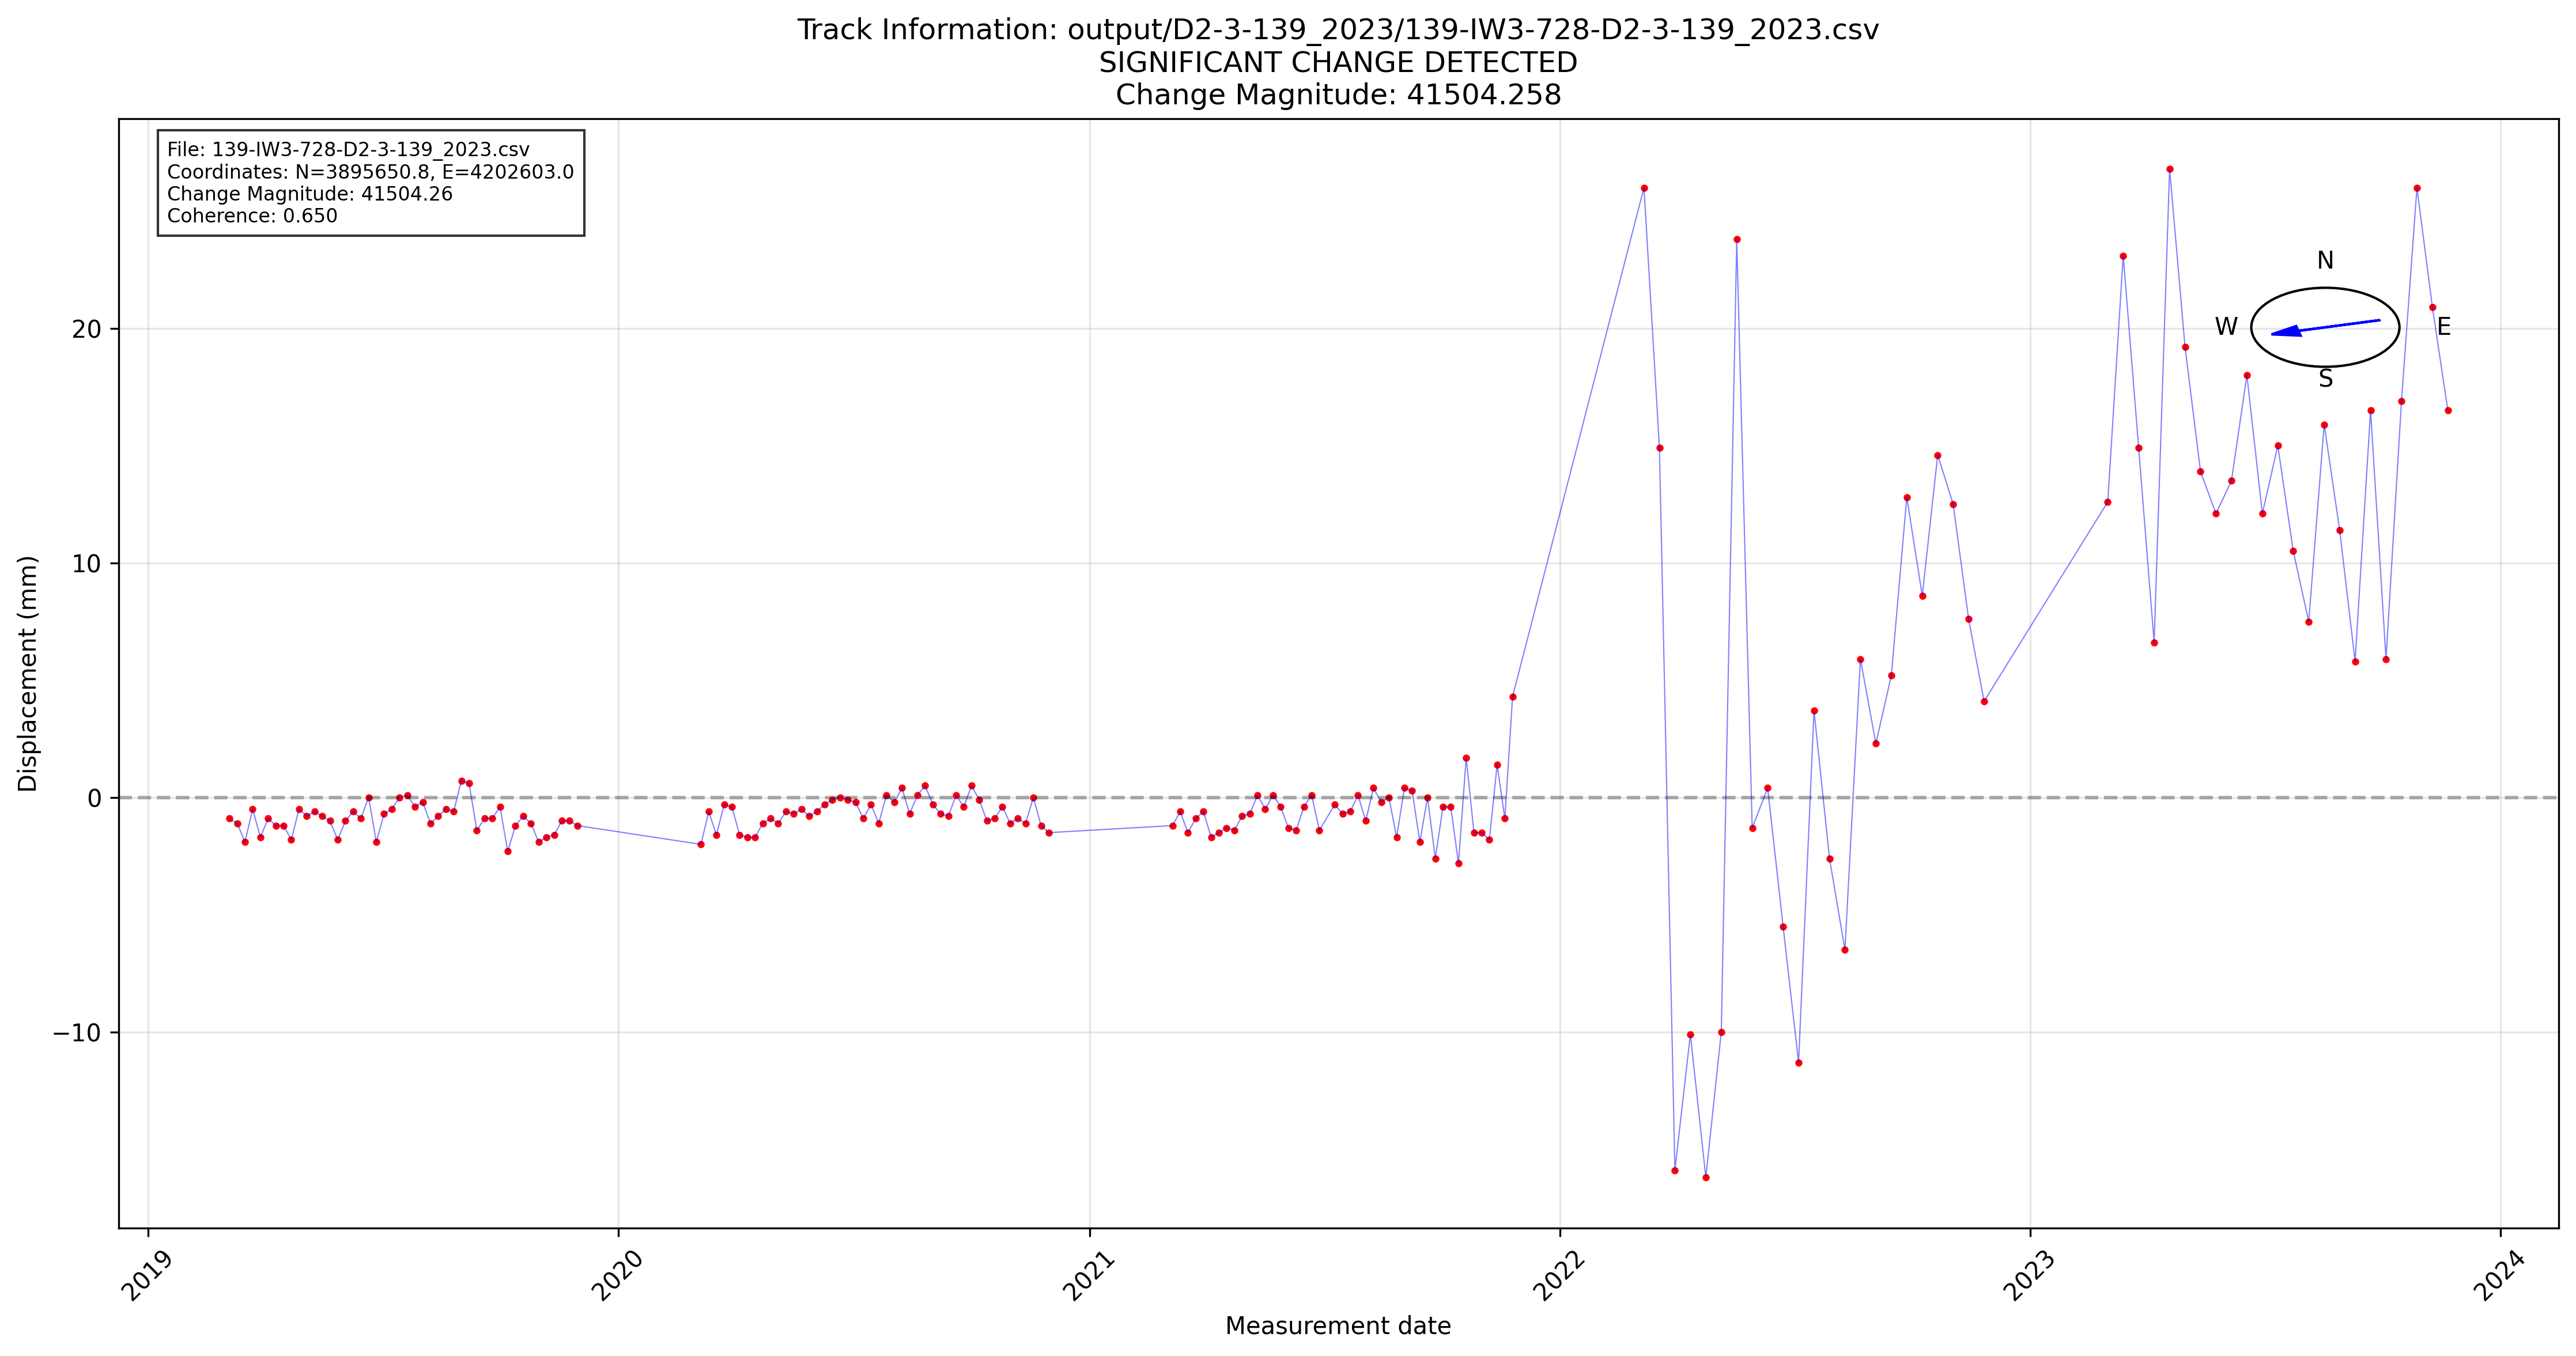
Real detection result showing ground motion change analysis with temporal progression and statistical confidence.
Getting Started
Ready to begin? Follow our Quick Start Guide to run your first analysis in minutes.